

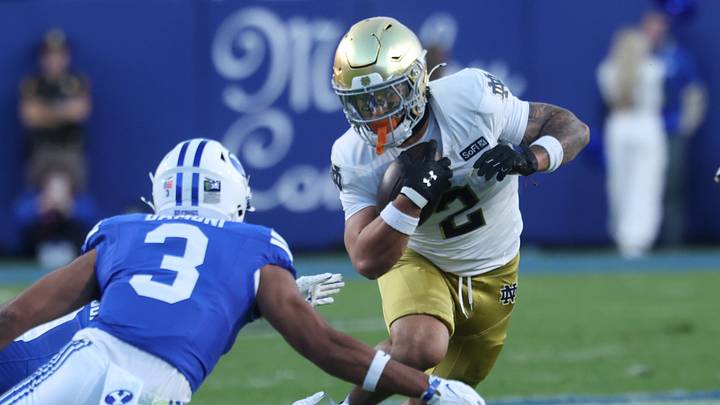
We all have our own unique opinions about the initial College Football Playoff rankings. While basically everyone (including me) agrees that they stink, we all have different ideas about why they stink. Part of it is because we have different ideas about what the committee should value, including win-loss record, strength of schedule, style points, head-to-head, etc. But we also all have our own biases. So before you make another angry comment about where everyone is ranked, I invite you to take one of my three blind resume tests.
Every week for the rest of the season, I'll give you three different options: the 5-team test, the 15-team test, and the 25-team test. This way, if you're a casual fan who doesn't want to spend a whole lot of time on this exercise, you don't have to, but if you want to prove that you're the second biggest BYU fan of all time behind me, you can go all in. The 5-team test will include BYU and four other teams of my choice. The 15-team test will be the top 15 teams, and the 25-team test will be the top 25 teams.
For each test, I will assign each team a letter. I won't tell you who each team is. Instead, for each team, I will give you their assigned letter, their win-loss record. their Higinbotham strength of schedule ranking and their FPI strength of schedule ranking (so you can choose which one you prefer) their average scoring margin, the assigned letter for all the ranked teams they've beaten and lost to (or if they're not included in the test, their CFP ranking denoted by "CFP" followed by the number they're ranked at), and the number of unranked teams they've lost to.
In case you want to know how the Higinbotham strength of schedule rankings work, it's 50% based on your opponents' combined win percentage, 25% based on your opponents' opponents' combined win percentage, 12.5% based on your opponents' opponents' opponents' win percentage, and so on, with the necessary adjustments to make sure winning doesn't hurt your strength of schedule.
This way, teams will only be rewarded for what conference they're in if that conference has actually outperformed other conferences on the field. The FPI strength of schedule model is more advanced, but it's also more biased in my opinion. (Because these are both rankings, the lower the number is, the better.)
Don't worry about accounting for everything. Only account for the things that you think are important.
After you've finished ranking the teams, check the corresponding key at the end to see who each team was and where you ranked them. I can only guarantee two things: one, your ranking will be very different from the actual rankings, and two, it will also be very different from what you expected.
5 team test:
Team | Record | Higinbotham SOS | FPI SOS | Average Scoring Margin | Ranked Wins | Ranked Losses | Number of unranked losses |
|---|---|---|---|---|---|---|---|
A | 6-2 | 9 | 9 | +13.6 | CFP 10, 12, 13 | CFP 24 | 1 |
B | 7-1 | 75 | 35 | +21.3 | Team E, CFP 24 | None | 1 |
C | 7-1 | 30 | 45 | +7.6 | CFP 11, 22 | None | 1 |
D | 8-1 | 20 | 31 | +15.6 | None | CFP 12 | 0 |
E | 6-2 | 16 | 7 | +17 | CFP 6, 21 | Team B, CFP 13 | 0 |
15-team test:
Team | Record | Higinbotham SOS | FPI SOS | Average scoring margin | Ranked wins | Ranked losses | Number of ranked losses |
|---|---|---|---|---|---|---|---|
A | 8-0 | 34 | 49 | +24.1 | CFP 16 | None | 0 |
B | 7-1 | 113 | 55 | +27 | None | Team H | 0 |
C | 6-2 | 43 | 4 | +13.1 | Team O, CFP 18 | Team D, CFP 24 | 0 |
D | 6-2 | 9 | 9 | +13.6 | Teams C, F, and K | CFP 24 | 1 |
E | 8-0 | 116 | 77 | +20.1 | CFP 23 | None | 0 |
F | 6-2 | 86 | 25 | +11.6 | Team N | Team D, CFP 21 | 0 |
G | 7-1 | 31 | 8 | +4.7 | Team O, CFP 21 | Team N | 0 |
H | 7-1 | 30 | 45 | +7.6 | Team B, CFP 22 | None | 1 |
I | 8-1 | 20 | 31 | +15.6 | None | Team K | 0 |
J | 7-1 | 51 | 68 | +13.3 | CFP 17, 22 | None | 1 |
K | 6-2 | 28 | 10 | +21.1 | Team I, CFP 19 | Team D, CFP 20 | 0 |
L | 7-1 | 75 | 35 | +21.3 | Team N, CFP 24 | None | 1 |
M | 8-0 | 77 | 83 | +18.9 | CFP 17 | None | 0 |
N | 6-2 | 16 | 7 | +17 | Team G, CFP 21 | Teams L and F | 0 |
O | 6-2 | 11 | 23 | +20.6 | None | Teams G and C | 0 |



25-team test:
Team | Record | Higinbotham SOS | FPI SOS | Average Scoring Margin | Ranked wins | Ranked Losses | Number of unranked losses |
|---|---|---|---|---|---|---|---|
A | 7-1 | 51 | 68 | +13.3 | Teams P and T | None | 1 |
B | 7-2 | 42 | 27 | +8.2 | Team S | Team H | 1 |
C | 6-2 | 16 | 7 | +17 | Teams Q and U | Teams V and D | 0 |
D | 6-2 | 86 | 25 | +11.6 | Team C | Teams N and U | 0 |
E | 6-2 | 73 | 29 | +9.3 | Team L | Team G | 1 |
F | 7-1 | 30 | 45 | +7.6 | Teams Y and T | None | 1 |
G | 6-2 | 43 | 4 | +13.1 | Teams I and E | Teams N and L | 0 |
H | 5-3 | 1 | 21 | +1.6 | Teams B and W | Team X | 2 |
I | 6-2 | 11 | 23 | +20.6 | None | Teams Q and G | 0 |
J | 8-0 | 34 | 49 | +24.1 | Team R | None | 0 |
K | 6-2 | 63 | 36 | +10.1 | None | Team S | 1 |
L | 5-3 | 3 | 3 | +1.6 | Teams N and G | Teams V, E, and U | 0 |
M | 8-1 | 20 | 31 | +15.6 | None | Team S | 0 |
N | 6-2 | 9 | 9 | +13.6 | Teams G, S, and D | Team L | 1 |
O | 8-0 | 77 | 83 | +18.9 | Team P | None | 0 |
P | 6-2 | 8 | 28 | +7 | None | Teams O and A | 0 |
Q | 7-1 | 31 | 8 | +4.7 | Teams I and U | Team C | 0 |
R | 7-1 | 88 | 43 | +21.3 | None | Team I | 0 |
S | 6-2 | 28 | 10 | +21.1 | Teams M and K | Teams N and B | 0 |
T | 6-2 | 74 | 52 | +14.3 | None | Teams F and A | 0 |
U | 5-3 | 24 | 15 | +8.1 | Teams D and L | Teams C and Q | 1 |
V | 7-1 | 75 | 35 | +21.3 | Teams C and L | None | 1 |
W | 7-1 | 58 | 79 | +12 | None | Team H | 0 |
X | 8-0 | 116 | 77 | +20.1 | Team H | None | 0 |
Y | 7-1 | 113 | 55 | +27 | None | Team F | 0 |
Alright, let's see how you did. Here's which letter was which team. I'll also tell you where I ranked each team when I did the tests myself. (You may notice that there were some inconsistencies with my rankings, so don't feel bad if the same thing happened to you.)
5-team test key:
Letter | Team | Current CFP ranking | Where I ended up ranking them |
|---|---|---|---|
A | Texas | 7 | 2 |
B | Georgia | 2 | 4 |
C | BYU | 9 | 1 |
D | Indiana | 4 | 3 |
E | Alabama | 5 | 5 |
15 team test key:
Letter | Team | Current CFP ranking | Where I ended up ranking them |
|---|---|---|---|
A | Miami | 1 | 1 |
B | Notre Dame | 11 | 14 |
C | Ole Miss | 10 | 13 |
D | Texas | 7 | 7 |
E | UCLA | 8 | 9 |
F | Tennessee | 13 | 15 |
G | Kentucky | 6 | 2 |
H | BYU | 9 | 3 |
I | Indiana | 4 | 4 |
J | Texas Tech | 15 | 5 |
K | Ohio St | 12 | 11 |
L | Georgia | 2 | 12 |
M | Utah | 3 | 6 |
N | Alabama | 5 | 8 |
O | LSU | 14 | 10 |
25-team test key:
Letter | Team | Current CFP ranking | Where I ended up ranking them |
|---|---|---|---|
A | Texas Tech | 15 | 4 |
B | USC | 20 | 19 |
C | Alabama | 5 | 9 |
D | Tennessee | 13 | 22 |
E | Missouri | 18 | 23 |
F | BYU | 9 | 3 |
G | Ole Miss | 10 | 16 |
H | Oregon | 23 | 18 |
I | LSU | 14 | 12 |
J | Miami | 1 | 1 |
K | Iowa | 19 | 24 |
L | Florida | 24 | 15 |
M | Indiana | 4 | 5 |
N | Texas | 7 | 6 |
O | Utah | 3 | 7 |
P | Houston | 17 | 11 |
Q | Kentucky | 6 | 2 |
R | Wake Forest | 16 | 17 |
S | Ohio St | 12 | 10 |
T | Arizona | 22 | 25 |
U | South Carolina | 21 | 21 |
V | Georgia | 2 | 8 |
W | Boise St | 25 | 14 |
X | UCLA | 8 | 13 |
Y | Notre Dame | 11 | 20 |
How did you do? Did your rankings look anything like the committee's rankings? Did they look anything like what you expected? If you answered yes to any of those questions, you probably cheated. This really goes to show how biased we all are, how quick we are to make false assumptions, and how important it is to look at all the information available before jumping to conclusions and acting like people are stupid if they disagree with us.
As I always say at the end of every article, remember to be kind to the officials.
 Add us as a preferred source on Google